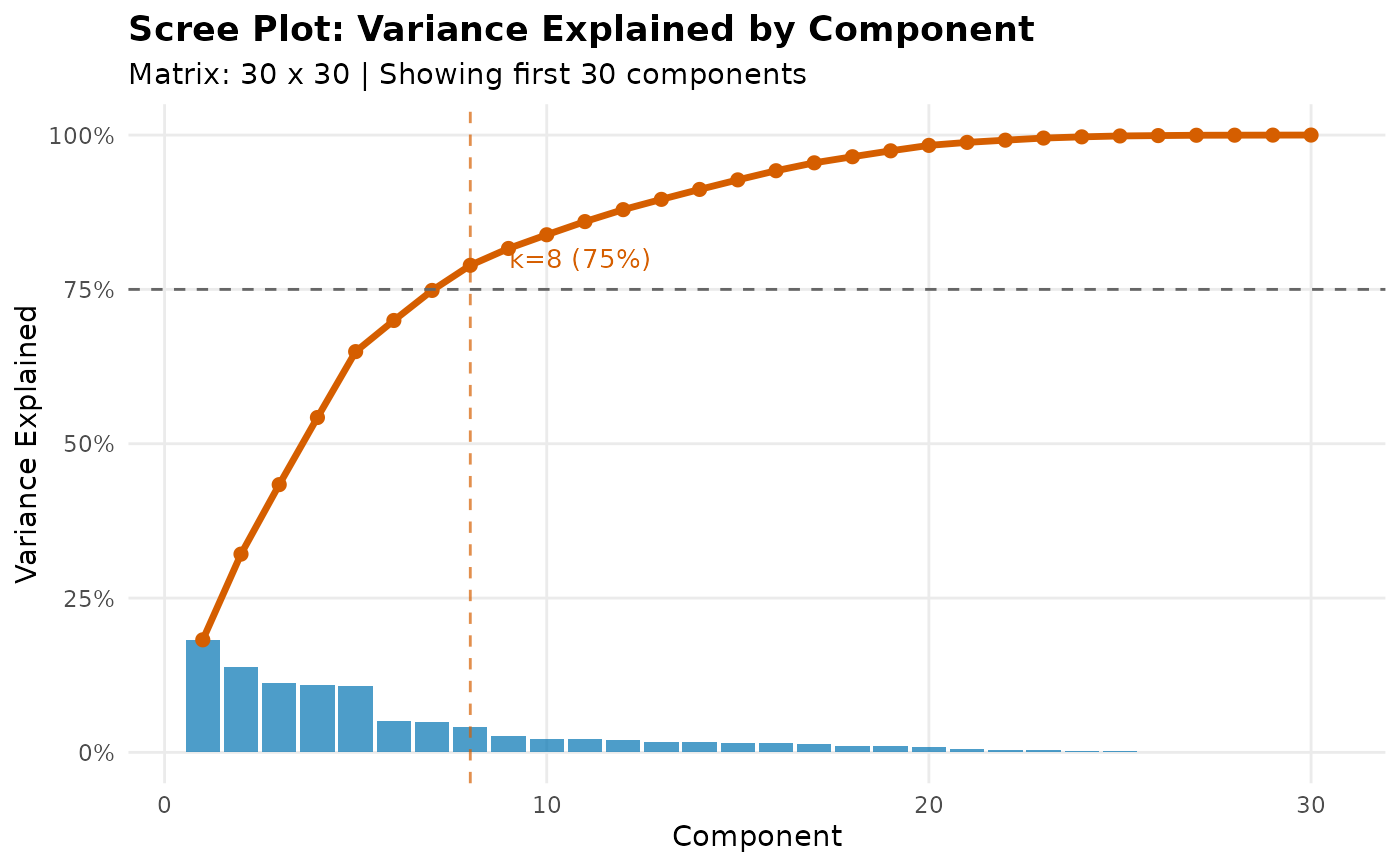
Creates a ggplot2 visualization of variance explained per component, useful for selecting the number of components (k) for dimensionality reduction.
Usage
plot_scree(
  mx,
  max_components = 50,
  variance_target = 0.75,
  show_elbow = TRUE,
  title = NULL
)
Arguments
- mx
A mobility matrix with totals row/column
- max_components
Maximum number of components to display. Default is 50.
- variance_target
Optional numeric (0-1) to show target variance line. Default is 0.75.
- show_elbow
Logical indicating whether to highlight the elbow point. Default is TRUE.
- title
Optional plot title
See also
reduce_density for using the selected k
Examples
# Generate test data
data <- generate_mobility_data(n_classes = 30, seed = 123)
# Basic scree plot
plot_scree(data)
 # With custom variance target
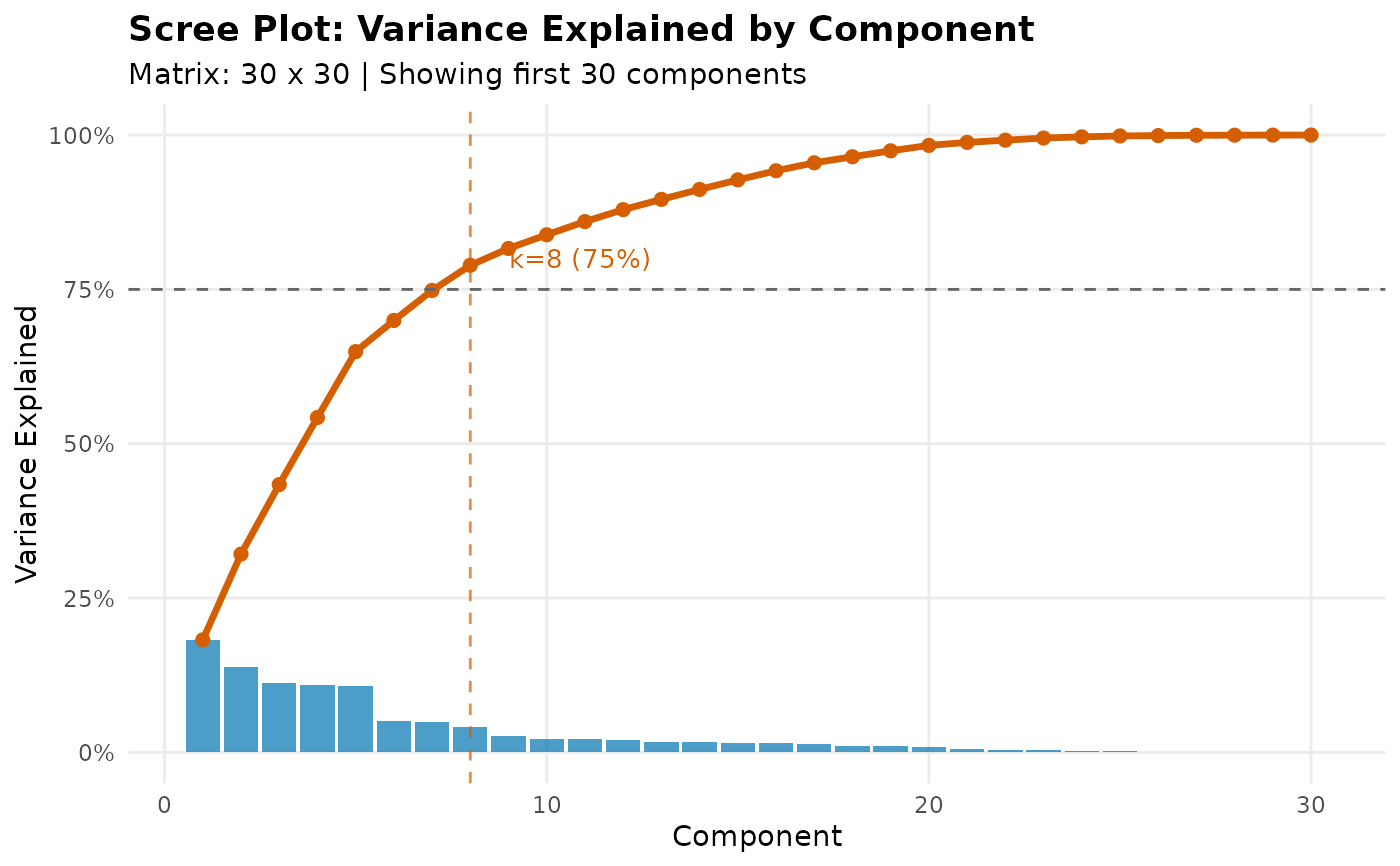
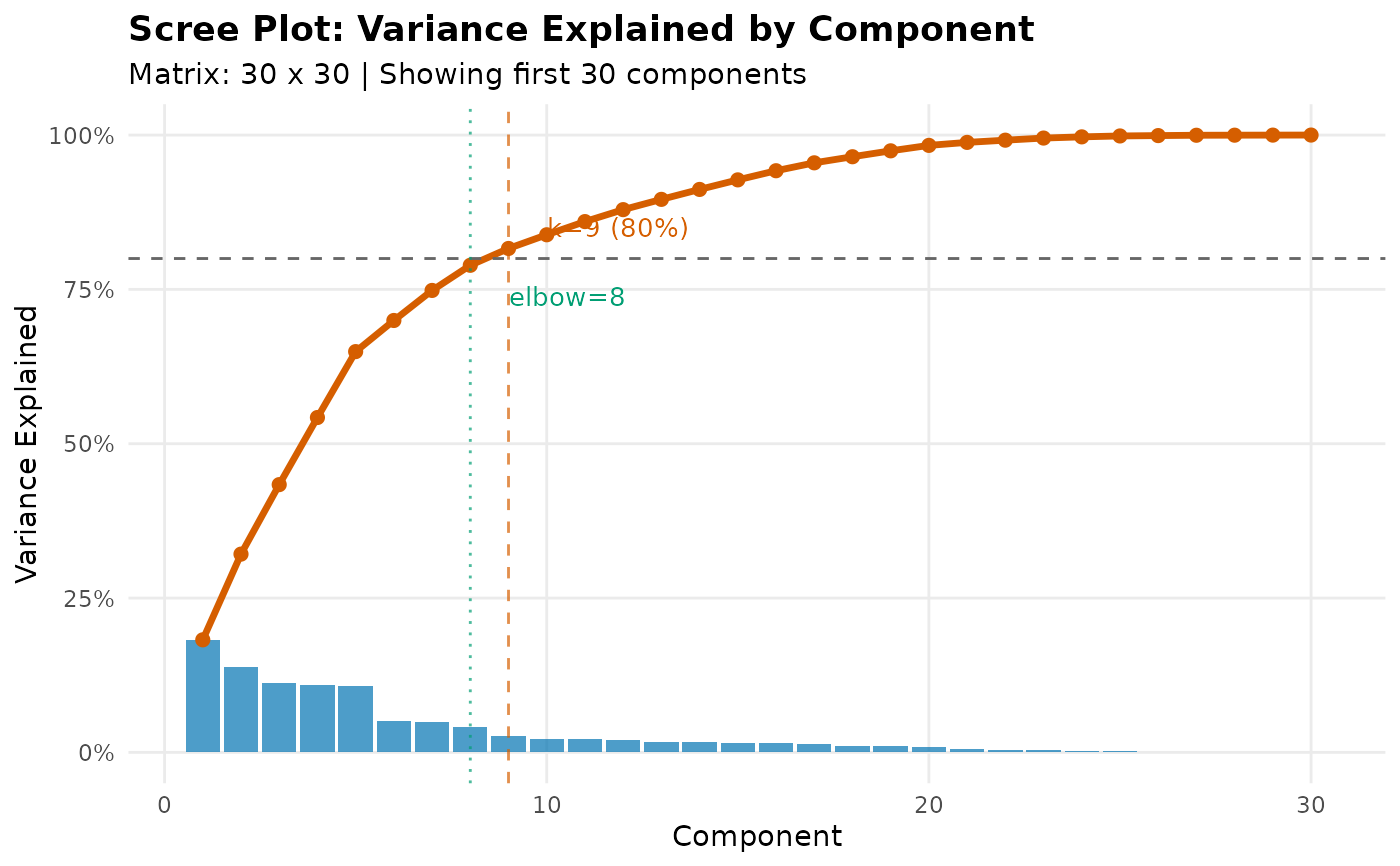
plot_scree(data, variance_target = 0.80)
 # Without elbow detection
plot_scree(data, show_elbow = FALSE)